Type of indicator
Quantitative
Relative dimension and aggregated criteria
Economic sustainability: Financial wealth: Capital
Description
- This measure gives an indication of the financial wealth of the farm business. It is defined as the difference between the value of total assets and of total liabilities, divided by utilised agricultural area (UAA) to account for the variation in farm size.
- Liabilities and assets are valued at the end of the calendar year.
Indicator calculation
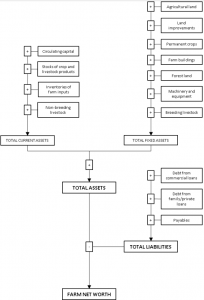
[(𝐹𝑖𝑥𝑒𝑑 𝑎𝑠𝑠𝑒𝑡𝑠 𝑎𝑡 𝑐𝑙𝑜𝑠𝑖𝑛𝑔 𝑣𝑎𝑙𝑢𝑎𝑡𝑖𝑜𝑛) + (𝐶𝑢𝑟𝑟𝑒𝑛𝑡 𝑎𝑠𝑠𝑒𝑡𝑠 𝑎𝑡 𝑐𝑙𝑜𝑠𝑖𝑛𝑔 𝑣𝑎𝑙𝑢𝑎𝑡𝑖𝑜𝑛)− (𝑇𝑜𝑡𝑎𝑙 𝑙𝑖𝑎𝑏𝑖𝑙𝑖𝑡𝑖𝑒𝑠 𝑎𝑡 𝑐𝑙𝑜𝑠𝑖𝑛𝑔 𝑣𝑎𝑙𝑢𝑎𝑡𝑖𝑜𝑛)] / UAA
Unit
€/ha
Indicator interpretation
Higher values indicate larger wealth and thus better economic sustainability.
Scale definition
| Scales | Values (€/ha) | Dexi interpretation | References | |
| >=75th percentile | >= 14545.81 | High | + | Based on the FADN data distribution |
| for EU specialised dairy farms. | ||||
| [median; 75th percentile] | [8488.02; 14545.81] | Medium to high | Quantile method, 2016-2018 data. | |
| [25th percentile; median] | [3356.18; 8488.02] | Medium to low |
||
| < 25th percentile | < 3356.18 | Low | – | |
As a summary, the formulas used to calculate farm net worth is represented in figure 3.