Type of indicator
Quantitative
Relative dimension and aggregated criteria
Environmental sustainability: Agroecosystem biodiversity
Description
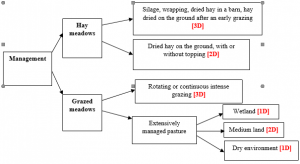
This indicator evaluates the ecological value of grasslands based on management and surface areas. Depending on these two characteristics, grasslands can be important shelters for biodiversity. For this indicator, grasslands are given two scores depending on the following management strategies:
- Fertilisation:
| Fertilization code | Mineral fertilizer | Organic fertilizer |
| 1F | 0 | Very occasional |
| 2F | 0 | Regular |
|
3F |
< 80 N units /ha/year (mowing) |
Occasional |
| < 40 N units /ha/year (grazing) | ||
|
4F |
< 80 N units /ha/year (mowing) |
Regular |
| < 40 N units /ha/year (grazing) | ||
|
5F |
> 80 N units /ha/year (mowing) | With or without intake |
| > 40 N units /ha/year (grazing) |
Grassland management types under consideration are the following:

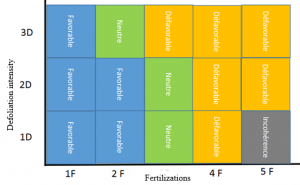
Then, the fertilisation and management scores are combined to determine if the grassland is a favourable, neutral, or unfavourable area for biodiversity, using the following scoring matrix:

After assessing each grassland with the matrix, the results are aggregated at the farm level to obtain a percentage of favorable or neutral grassland surface area to total grassland surface area. This indicator is adapted from Manneville et al. (2014).
Blue = favorable (Bdv2), Green = neutral (Bdv1), Yellow = unfavorable (Bdv0)
Aggregation of the scores: ((Bdv1+ Bdv2) / (Bdv0 +Bdv1+ Bdv2))*100
𝐵𝑑𝑣0 = Neutral grassland surface area in ha
𝐵𝑑𝑣1 = Favorable grassland surface area in ha
𝐵𝑑𝑣2 = Unfavorable grassland surface area in ha
Unit
Percentage
Indicator interpretation
Lower values indicate larger negative impacts on the environment.
Scale definition
| Scale | Dexi interpretation | References | |
| >45 | High | + | Adapted from (Manneville et al., 2014) |
| [25; 45] | Medium | ||
| [0; 25] | Low | – | |
References
Adapted from (Manneville et al., 2014)
